CLIMORA

PLATFORMS, DATA & HARDWARE

PRODUCTS

Ready-made solutions to integrate climate data, reports and field monitoring — from cloud to sensor.

Climora platform

The dashboard where our own stations, heat maps, fields and agronomic recommendations come together — fed in real time by the Weather Brasil engine.

Climora brings together data from our field stations with the historical and real-time data processed by the Weather Brasil engine. In one place: live network readings, a heat map with a timeline, wind rose and alerts, forecasts, water balance, spray windows, ET0 with per-pivot irrigation recommendations and full field management — every number on screen is generated by the engine from validated data.
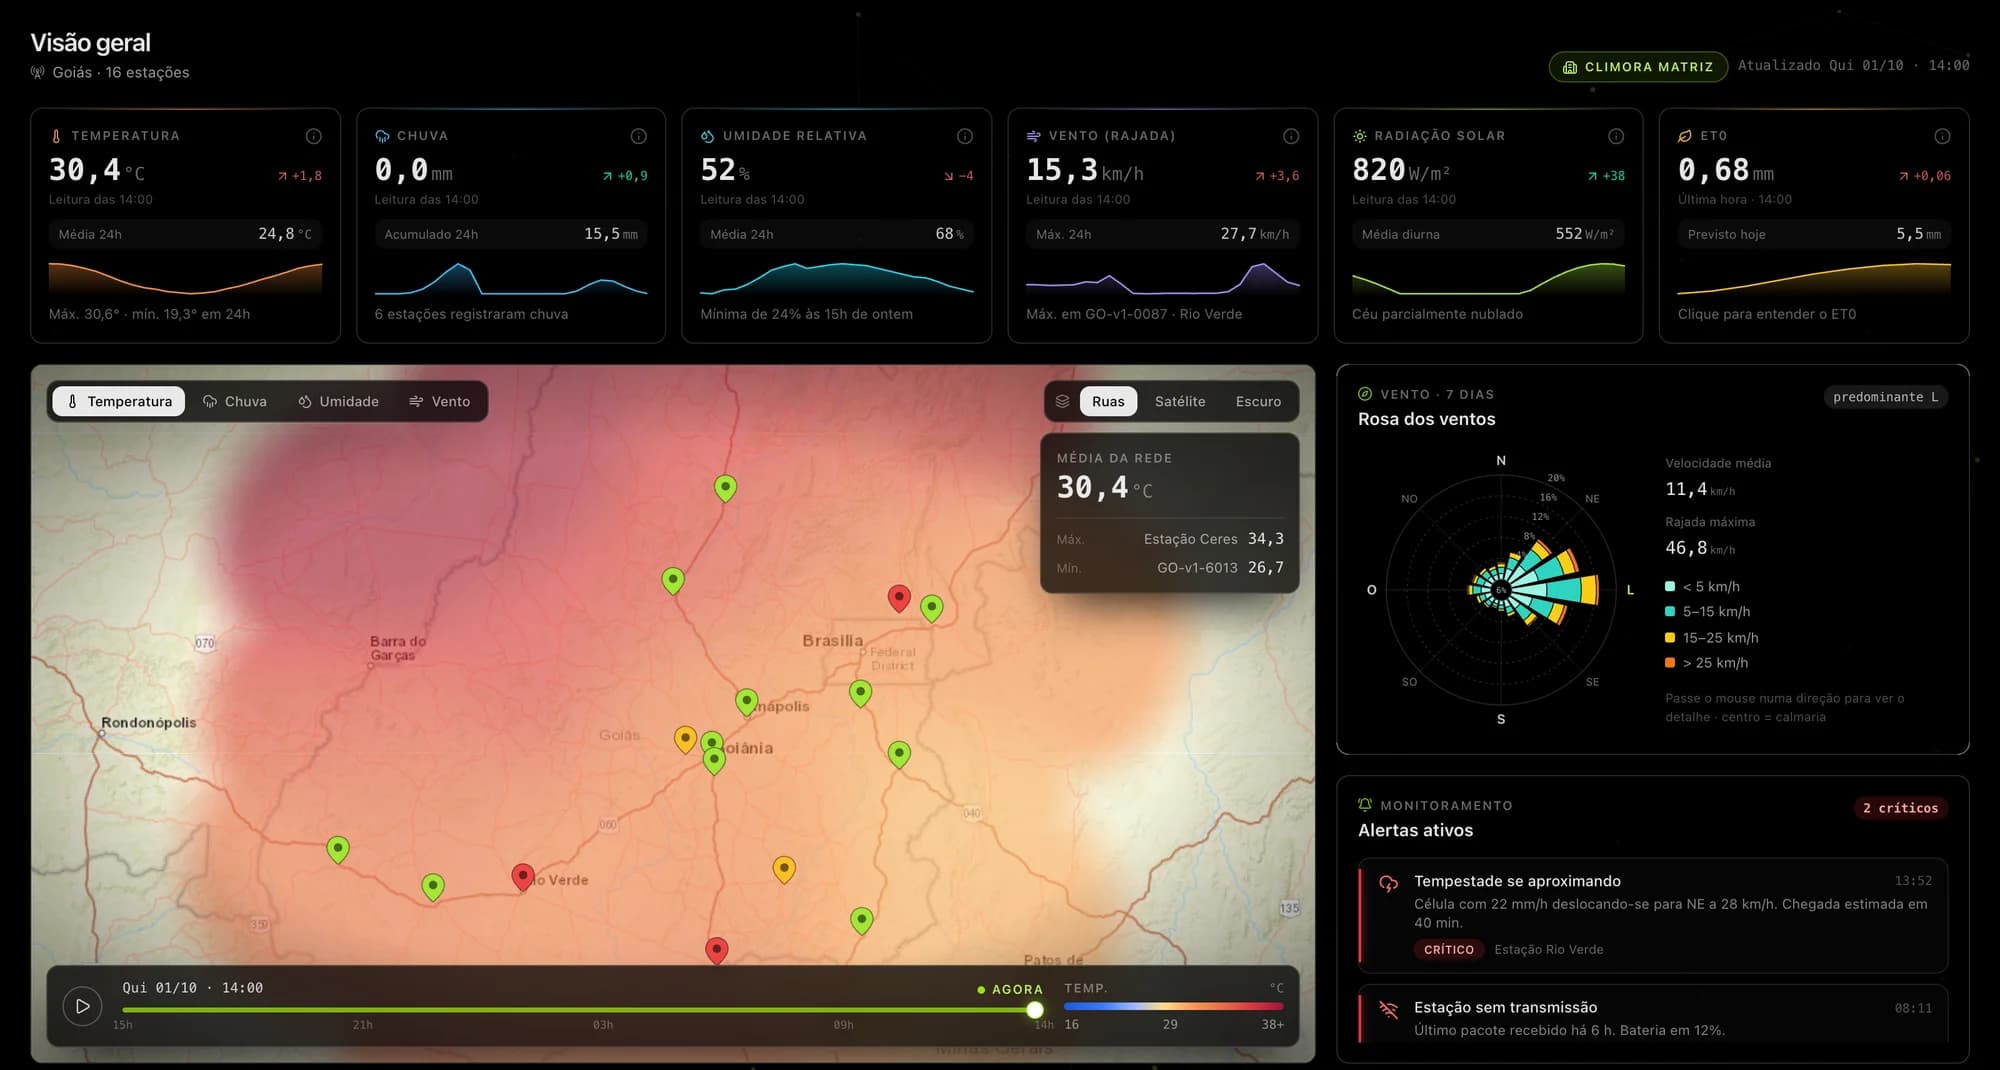
Climora platform home screen with indicators, heat map, wind rose and alerts

Weather Brasil · climate data engine

The engine that integrates INMET and ANA, rebuilds the entire history and processes every new reading in real time.

Weather Brasil is the data engine behind Climora. It connects continuously to the INMET and ANA networks, rebuilds complete historical series — filling gaps, fixing inconsistencies and homogenizing decades of records — and processes every new reading in real time, with validation and quality control on arrival. Together with data from our own stations, it generates every indicator, map, forecast and recommendation used across the Climora platform.

Weather Brasil platform visual and Brazilian climate data

Weather station

A fixed measurement point that regularly records what happens in the air and soil around the sensor: wind, temperature, humidity, rain and, depending on the model, radiation and pressure. No wires during deployment, no reliance on local Wi-Fi and no field trips to collect records — transmission and storage run autonomously, with 100% independent daily operation. This data supports alerts, historical series and analysis for agriculture, construction, events and risk management.

Climora weather station in the field

Historical reports: Brazil's climate in long series

Series from the 2000s, based on the INMET network, at three levels of detail — national, regional and local — plus an overview of the evolution and coverage of data and stations.

Weather Brasil's historical reports translate decades of meteorological records into clear reading for planning and decision-making: long-term trends, extremes, accumulated rainfall, temperature and wind, with visualizations and comparisons according to the chosen scope. The evolution and coverage module shows how the station network and record quality evolve over time (data without AI completion, for methodological transparency).

Heat map and historical climate data for Brazil

Unified layer: INMET, ANA and ERA5

Integration and harmonization of surface observations, hydrological series and reanalysis fields — a single pipeline with metadata and traceability.

We combine INMET network data, ANA series and stations and ERA5 reanalysis products into a coherent view: same units, grids and periods where applicable, with explicit fusion and validation rules. The goal is to reduce silos between meteorology and hydrology, accelerate cross-referencing for models and reports and support decisions with a single query interface — from station to reanalysis field, without manual copies between systems.

Visualization of INMET, ANA and ERA5 climate data integration